
Don’t Sweat Crude Unless These 3 Things Happen
February 16, 2016"We don't choose experiences, we choose memories. "
-Daniel Kahneman
Sorry for the click-bait subject line. To get to the point: the price of Crude is likely going to rip to the upside over the next year, unless we’re in a period like Jan 1985, Aug 1997 or Feb 2015.
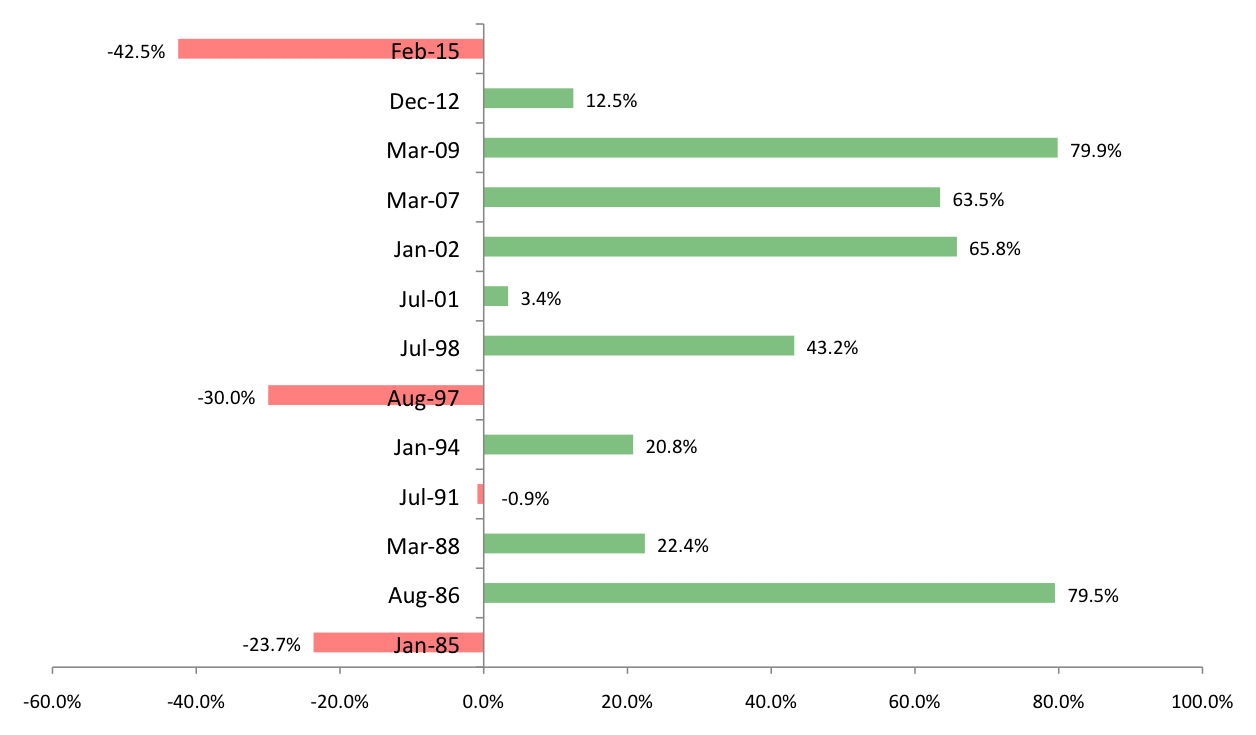
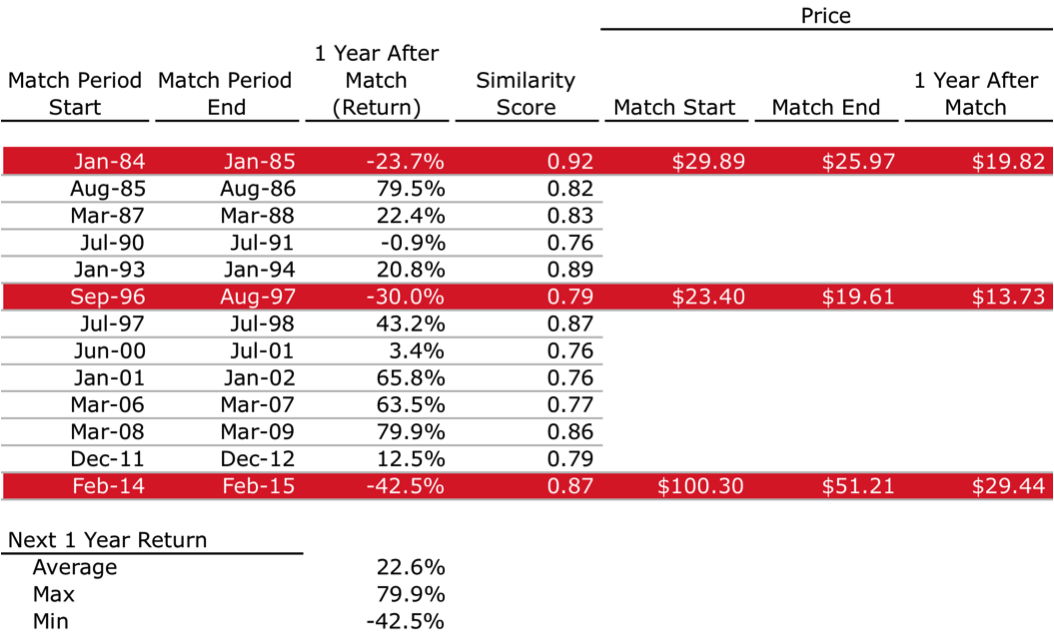
EidoSearch shows 13 periods in history with similar conditions matching today’s environment. 9 of the 13 matches were up in the next year with an average return of 23%, a max return of positive 80% and a min return of negative 43%. The chart below shows the time periods and returns following these 13 matches.
There’s money on the sidelines chomping at the bit to buy beaten up energy stocks, so if you find yourself in that mindset, you should spend time exploring the 3 stories where continued declines occurred, highlighted in the table below. If you can still sleep at night, knowing these parts of history, then you’ve performed an important stress test.
In the 1980’s:
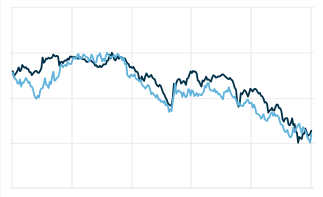
The chart below shows the similarity in the price of crude from Jan 1984 – Jan 1985 (black) as compared to Feb 2015 – today (blue).
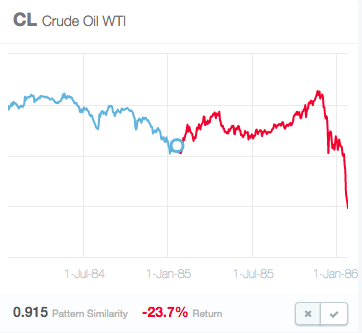
The chart below shows the continued 23.7% decline (in red) through Jan 1986, after the match period from Jan 1984 – Jan 1985 (in blue).
A few highlights from the historical context:
Source: Wikipedia
1984
March – June: Iran mobilizes 500,000 troops to southern front.
May 26: U.S. President President Ronald Reagan rules out U.S. military intervention.
October: Norway and Britain cut prices in response to falling spot market. Nigeria follows, renewing pressure on OPEC price cuts.
October 17: OPEC cuts production to 16 Mbbl/d (2,500,000 m3/d), but agreement is negated by cheating and price-discounting.
1985
July: OPEC loses customers to cheaper North Sea oil. More OPEC price cuts.
Aug 15: First Iraqi air raid on Iran’s main oil export terminal, Kharg Island.
December: OPEC output hits 18 Mbbl/d (2,900,000 m3/d) boosting a glut and triggering a price war.
In the 1990’s
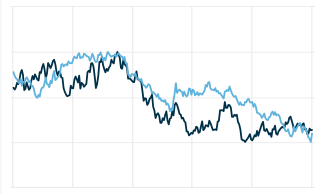
The chart below shows the similarity in the price of crude from Sep 1996 – Aug 1997 (black) as compared to Feb 2015 – today (blue).
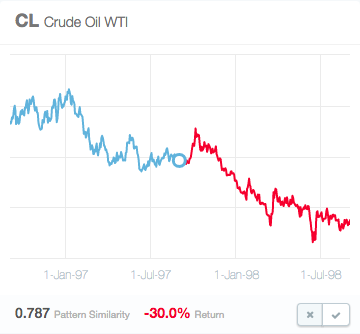
The chart below shows the continued 30.0% decline (in red) through Aug 1998, after the match period from Sep 1996 – Aug 1997 (in blue).
A few highlights from the historical context:
Source: Wikipedia
1996
January 17: Iraq agrees to talks concerning a U.N. plan to allow for the Iraqi sale of $1 billion of oil for 90 days for a 180-day trial period.
December 30: The United Nations announces that a total of 21 contracts have been approved for the limited Iraqi oil sales under U.N. Resolution 986. The approved contracts will allow for 43.68 million barrels of oil to be exported in the first 90 days of the sale. At present, exports of 26.37 million barrels have been approved for the second 90-day period of the sale, which allows Iraq to sell up to $1 billion worth of oil every 90 days for an initial 6-month period.
1997
February 24: Qatar inaugurates the world’s largest liquefied natural gas (LNG) exporting facility and formally launches Qatar Liquefied Gas Co., which will have total output capacity of 6 million tons per year of LNG.
In the 2010’s
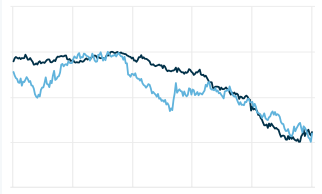
The chart below shows the similarity in the price of crude from Feb 2014 – Feb 2015 (black) as compared to Feb 2015 – today (blue).
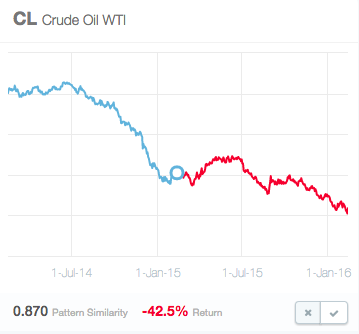
The chart below shows the continued 42.5% decline (in red) through Feb 2016, after the match period from Feb 2014 – Feb 2015 (in blue).
A few highlights from the historical context: It was just last year, so use your memory.
Have a great week.