
Nat Gas Set for Winter Rebound?
November 24, 2015"Oh, the silent majesty of a winter’s morn…the clean, cool chill of the holiday air….a (donkey) in his bathrobe, emptying a chemical toilet into my sewer "
-Clark W. Griswold, Christmas Vacation, 1989
Like Clark Griswold’s storm sewer, Natural Gas prices are at toxic levels that would even depress cousin Eddy (unless he heats the RV with Nat Gas). After peaking above $6 in February of last year, prices are streaking back down towards $2 again. Will the colder weather prop up prices?
Inventories aren’t helping the case. There is now an all-time high of over 4 trillion cubic feet in storage, which is more than 10% higher than last year’s levels. We have also had mild weather so far in November, representing a bit of a bummer to the start of the heating season and continued focus on supply issues. Prices typically rise ahead of the peak heating season we’re entering, but is there a better way to evaluate what the “typical” case is?
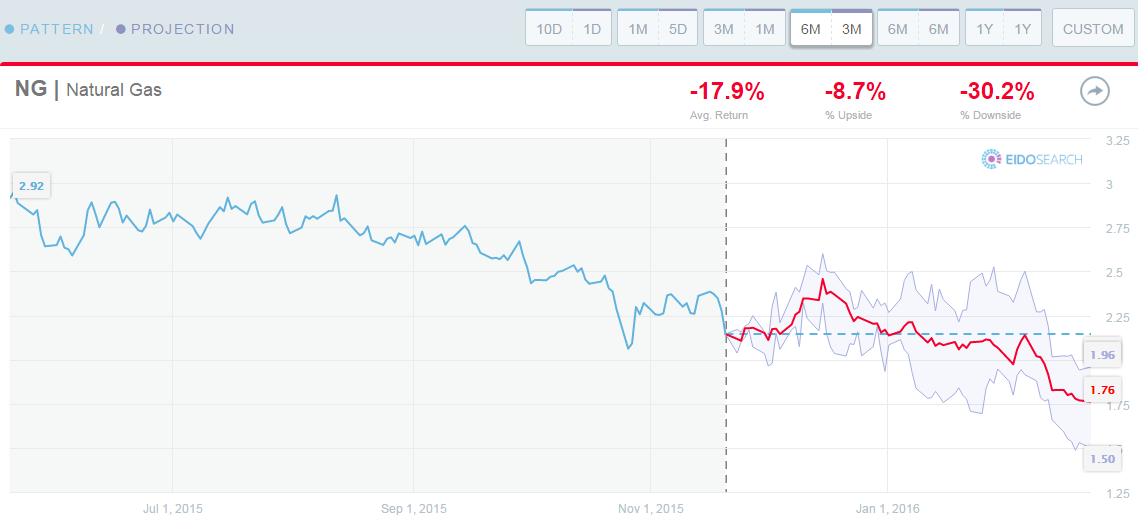
EidoSearch analyzed the trading pattern in Natural Gas, to get some statistics on what the next 3 months trading might look like given similar conditions historically. By taking the conditions of the trading behavior in Natural Gas and finding like instances historically, that allows us to capture statistics on how the market has reacted to these similar conditions historically and to get better information about the future.
To do this, we took the current 6 month trading pattern and found 19 statistically similar occurrences over close to 30 years of Nat Gas (NG) trading history. Then, given the importance of seasonality, we narrowed even further to only include similar patterns that ended in October or November. This brought us to 4 historical matches.
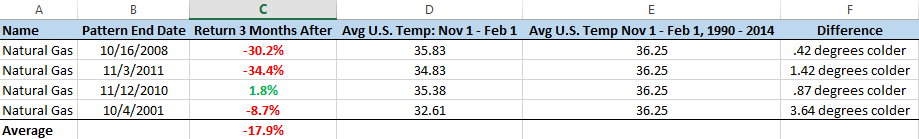
The 4 most similar matches are from 2001, 2008, 2010 and 2011. The Average return is -17.9%, and only in 2011 is Nat Gas up in the next 3 months a meager 1.8%. The average return is displayed in the chart below.
We then further add relevancy by capturing the average temperature in the next 3 months (November through January) in each of those years, and comparing it to the historical average for those three months from 1990 – 2014. Given that the price in these 4 instances is down an average of -17.9%, you would expect that the weather was warmer in these periods compared to the national average for the November through January period. Per the table below that wasn’t the case.
Even when the colder weather hits, the supply issue might still overwhelm the conversation.
Have a great Thanksgiving!