
1 Month Call Options for GM and Toyota Look Cheap
June 1, 2015"The best qualification of a prophet is to have a good memory"
-George Savile
Forecasting future returns and volatility is a common practice littered with inherent “bugs”. Many models start with the assumption that markets will be efficient for ease of modelling, and apply normal distributions to forecast future returns and volatility for everything from risk management to asset valuations. We’ve learned time and again that this can be shaky ground to stand on.
EidoSearch has a methodology that does not require set assumptions to model future returns and volatility. We simply take the conditions in current patterns in a securities price, and find similar instances within a peer group to capture the historical return distributions for this security across all environments over the past 40 years. Our edge is that we can search through millions of patterns per second and thousands of securities to find the outliers, and as new data comes in the forecasts adapt dynamically.
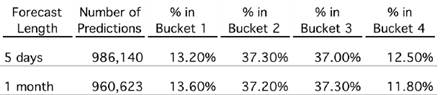
We know that our distributions contain information if they are distinct from the typical outcome over the same period (as you will see in the linked GM and Toyota projections below). Then, we need to verify that our forecasted return distributions are accurate, in a robust manner. We’ve done this by looking at the S&P 500 back to 2006 and doing 5 million predictions across multiple time horizons. We simply track the accuracy of our projected return distributions to see if they fall within the probable range forecasted, and to gauge the consistency across time horizons.
Here’s a table showing the back test results for two shorter forecast periods, and the consistency in predicting future return distributions:
Portfolio Managers and Traders are now incorporating our forecasted return distributions into their investment process to understand where the magnitude or skew of our forecast is different than what the market is pricing into Options for implied volatility. The applications range from generating trade ideas to bolstering risk management.
We ran billions of pattern comparisons over the weekend, and found a couple of stocks with 1 month options where our forecasted return probabilities are significantly different than what implied volatility is pricing in.
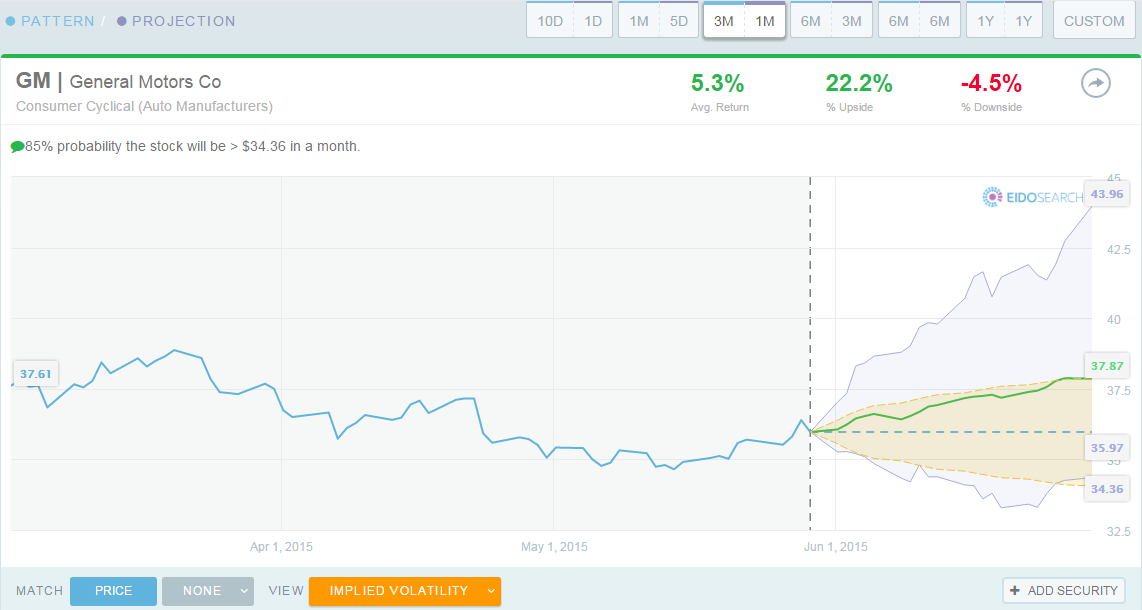
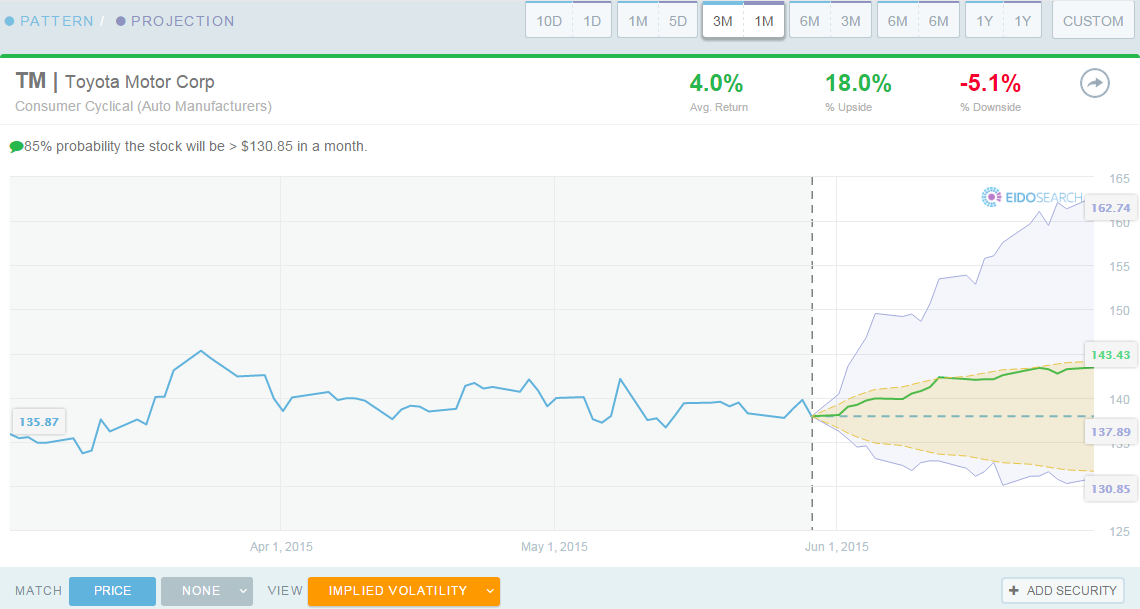
For each of the projections below, implied volatility is overlaid in orange. The upper and lower bounds in light blue represent 70% probability that the stock price will be in that range in the next one month.
Stats for GM:
· Using the current 3 month price trend to find similar matches in the peer group
· The historical matches are up 62.6% of the time an average of 5.3%
· 5.0x the upside to downside in the forward 1 month
Stats for Toyota:
· Using the current 3 month price trend to find similar matches in the peer group
· The historical matches are up 62.2% of the time an average of 4.0%
· 3.5x the upside to downside in the forward 1 month
Have a great week!