
A Gauge for the Pull-Back in China
June 29, 2015"Once bitten by a snake, one is scared all his life at the mere sight of a rope"
-Chinese Proverb
If you ever wanted a good example of how investor behavior, and in particular fear, plays a role in the movement of asset prices, look no further than the Chinese stock market.
The Shanghai SE Composite Index had been on an epic tear through mid-June, running up over 150% in less than a year. Irrational Exuberance? In just the last two weeks of trading, the SSE has given up more than 20% of those gains and the sell-off is accelerating. Want an objective view on how far it might fall?
We’ve seen this kind of behavior in stock markets around the world multiple times in recent history. By finding other times where a stock market has risen with similar trajectory, and started pulling back with similar voracity, we get statistics and a gauge for the likely outcomes for China today. This isn’t about finding perfect analogs, because there aren’t any. This is about a set of returns and statistics that are able to objectively inform us about the future, and can support or challenge current views.
The Study
We looked at the current 11 month price trend from the start of its impressive run-up, as well as a shorter term 3 month price trend that more effectively captures the trajectory of the recent pull-back. We used a mathematical similar measure that focuses more on the size of moves in a pattern, and set a high minimum threshold for what the EidoSearch engine considers a statistical match.
Finally, we looked at all Global Indices to get a significant number of results for each scenario, but also narrowed to the SSE’s history only to see how that particular market reacts to similar environments.
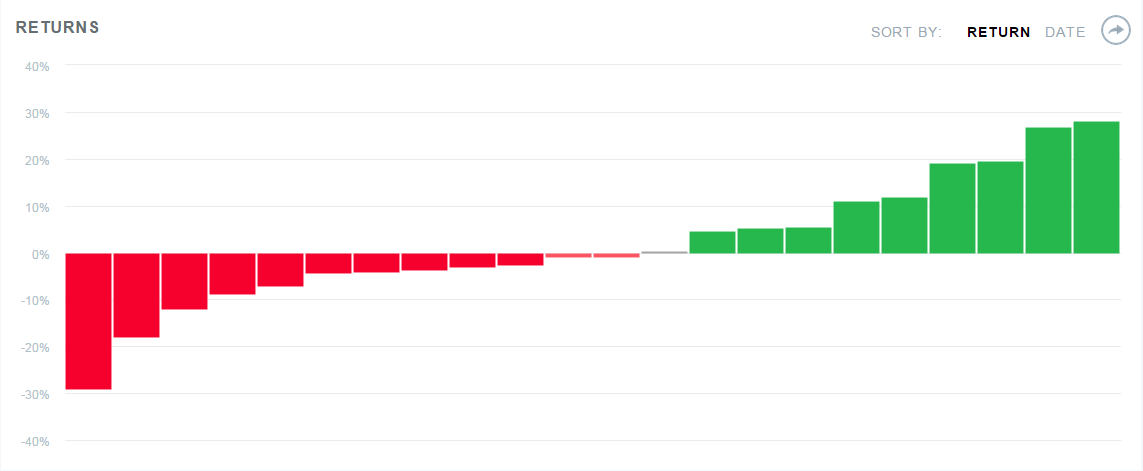
Using the current 11 month price trend, we found 22 similar matches across global markets
The SSE in 1 month:
· 12 of the 22 are still down in 1 month
· Average return of all 22 is 1.7%
· Worst instances:
-Thailand in 1987, -29.0%
-Nasdaq 100 in 2000, -17.9%
· Matches in Shanghai’s history:
-2007, 5.3%
-1996, 5.4%
-1992, 19.0%
· Chart of the 1 month historical returns for all 22 matches (below)
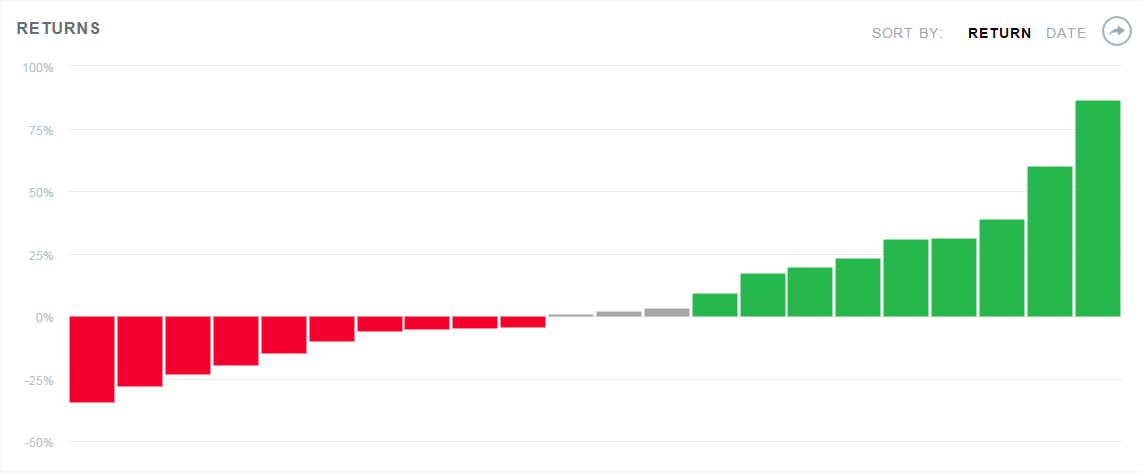
The SSE in 3 months:
· 12 of the 22 are up in the next 3 months
· Average return is 7.8%
· Worst instances:
-Thailand in 1987, -43.0%
-FTSE in 2000, -27.9%
· Matches in Shanghai’s history:
-2007, 38.6%
-1996, 31.2%
-1992, 60.1%
· Chart of the 3 month historical returns for all 22 matches (below)
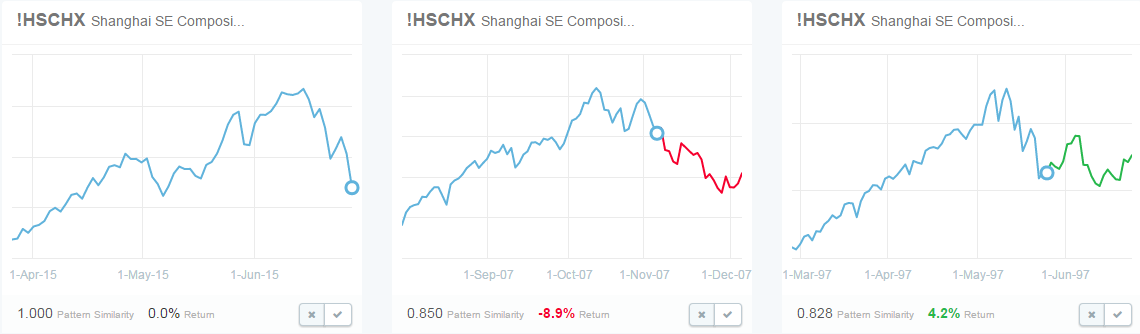
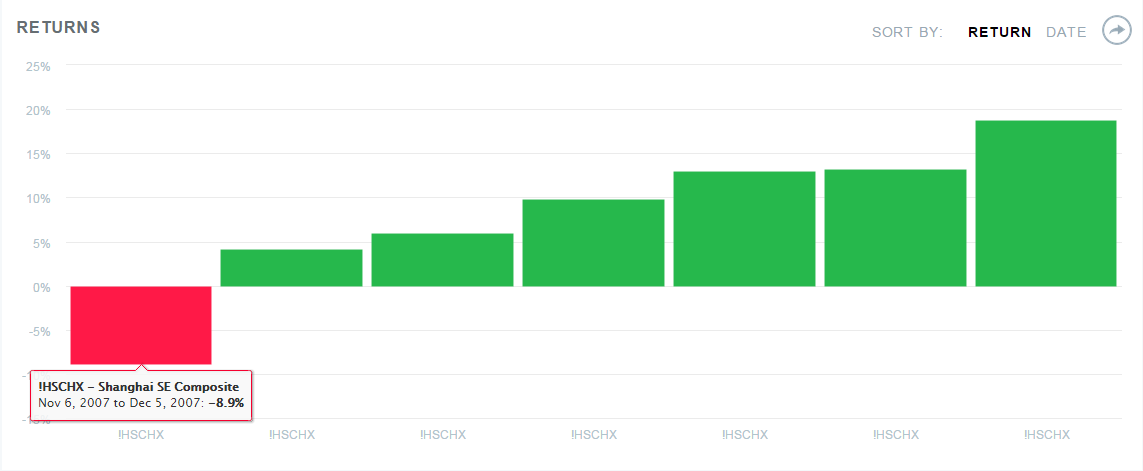
Using the current 3 month price trend just in the SSE’s history
We found 7 similar matches dating as far back as ’91-’92. The Index has been up 6 out of the 7 times an average of 8.0% in the next 1 month. The worst instance is from 2007 where the Index continues down another -8.9%.
Best Matches are from 2007 and 1997:

When looking across global markets, using the 11 month price trend, the markets are down more than they are up and a few of the tails are pretty ugly. However, the winners still outperform the losers and when using just the Shanghai’s history, the results have been much more positive than peers albeit with a much smaller number of matches.
Have a great week!