

AmEx (AXP), Kohl’s (KSS) and Statistical Significance
By EidoSearch"The best thing about the future is that it only comes one day at a time."
-Abraham Lincoln
Watching some of the NBA and NHL playoffs over the weekend, or at least getting the recaps on ESPN (kids soccer games), it was hard to ignore the proliferation of statistics being thrown at viewers:
· “When a best of 7 NBA series is tied 2-2, the winner of game 5 goes on to win the series 82% of the time.”
· “Hockey teams that have a goal differential over 20 during any point during the playoffs have won the Stanley Cup 9 out of 16 times.”
These are interesting factoids, and provide a barometer of sorts on the odds facing a team in different situations, but they are sorely lacking when it comes to depth of the conditions in these situations. Do the percentages change if the series started out 2-0 vs. 1-1? Does it matter if the game 5 winners plays the next game at home or on the road? These are additional conditions that can provide valuable information about the forward probabilities that are typically ignored.
Here’s another example. The Celtics and Lakers have won a combined 33 of the 64 NBA Championships ever played, so you can say that there’s a better than 50% chance that one of those teams will win the Title next year. It’s a correct stat, but disregards relevant conditions that can inform the probabilities of them winning next year. Both teams are god awful.
We utilize these types of statistics in everyday life, and they typically do a poor job of incorporating key conditions that can inform us because of the limitations of traditional models. As the conditions necessary to effectively model grow, and the data changes and continues to grow rapidly, traditional models start to break down due to the complexity. The other thing statistics often lack is significance. “9 out of 16 times” is not statistically significant, and stats like this are rarely back-tested.
EidoSearch provides analytics to the investment community by using the conditions in data patterns to inform decision makers with probabilities. These probabilities have been back tested in a proper framework (in sample parameters and out of sample testing) over 10 years and through millions of projections. What makes us effective is our ability to mathematically interpret the conditions in patterns, and to then powerfully search through millions of patterns per second to find relationships in the data that are significant.
EidoSearch scanned all large cap stocks overnight, and we’ve highlighted a couple of PROBABILITIES below. A few of the key conditions we used are:
· 6 month patterns in the end of day close prices
· Compared the patterns of these stocks to those in the same sector historically
· We used history back to the late 70’s
Based on our research, we know that using 70% of the historical returns of patterns with these conditions is accurate at predicting 70% of the future return distributions.
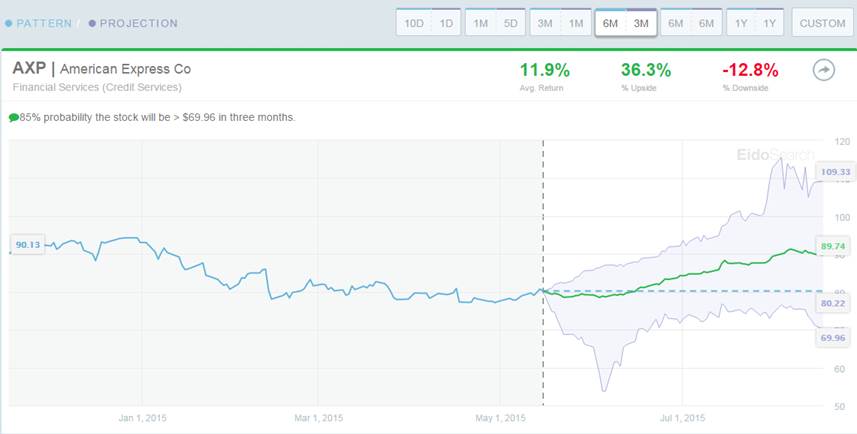
American Express (AXP)
Stats that stick out:
· Found 98 mathematically similar instances of this pattern in the peer group
· 3 times the upside to downside in the forward return probabilities
· Stocks with similar conditions historically are up 68.4% of the time an average of 11.9% in the next 3 months
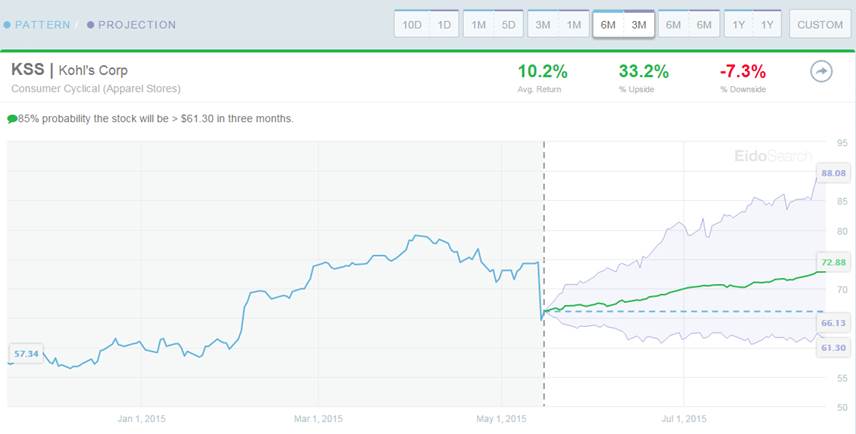
Kohl’s (KSS)
Stats that stick out:
· 4 times the upside to downside
· Stocks with similar conditions historically are up 69.1% of the time an average of 10.2% in the next 3 months
· 85% probability you’ll do no worse than a drop of -7.3%
If you have a fundamental view on AmEx or Kohl’s, these statistics can provide a relevant gauge on how the market has reacted to stocks with similar conditions historically.
It pains me to say this, but don’t bet on the Celtics.
Have a great week!