
Crude Oil in 1 Year?
August 10, 2015"The four most expensive words in the English language are ‘This time it’s different'"
-Sir John Templeton
Here we go again with Crude testing lows. We’re a buck or so away from the price bottom seen a couple of times in Q1, and prior to that during the Financial Crisis. In late June we had risen back above $60 a barrel and the discussion at the time was about the all-time great investment opportunities in the sector. Now we’re back to questioning sustainability for debt ridden U.S. drillers and getting anxious about what impact this will have on the U.S. and Global economies.
The players are different but the game is still the same
The confluence of factors impacting the environment right now for Crude Oil prices is unique and has never been seen before. Concerns include sliding demand in China and the impact on global supply levels in the near and long term, OPEC, North American drilling and output and an Iranian deal that could throw more supply into the market. What’s not unique is that this is mainly about forecasting supply and demand.
We’ve seen Crude Oil trade in a similar fashion in the past, based on investors similar impressions of where supply and demand was heading. Finding these analogs can provide great information about how the supply and demand picture is likely to play out today, and experienced investors can compare these times with current times to better detail how they think the markets will react.
At EidoSearch, we find these analogs in seconds, but also look at the full spectrum of these similar environments, through the trading patterns of investors, to provide analytics on the likely outcomes.
The Analogs
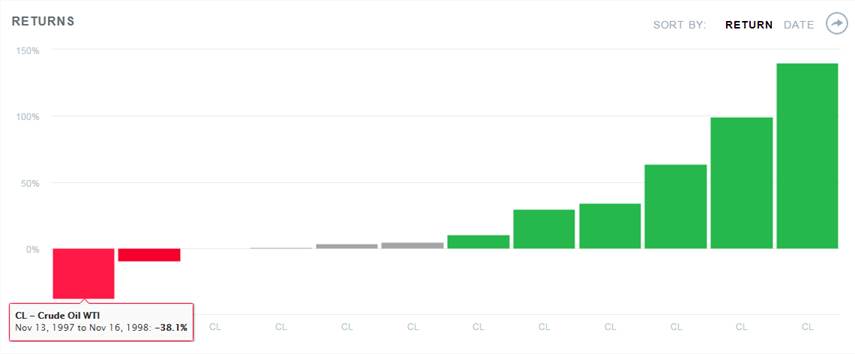
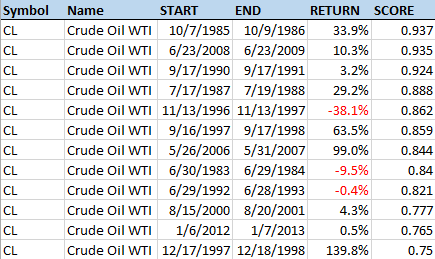
The table below highlights the 12 similar matches in Crude’s 1 year price trend we found dating as far back as 1983. We used a pretty high “similarity” threshold for including matches, which can be strengthened or loosened. The 4 most similar analogs from history are all up in the next 1 year, with 1985-1986 being the most statistically similar match.
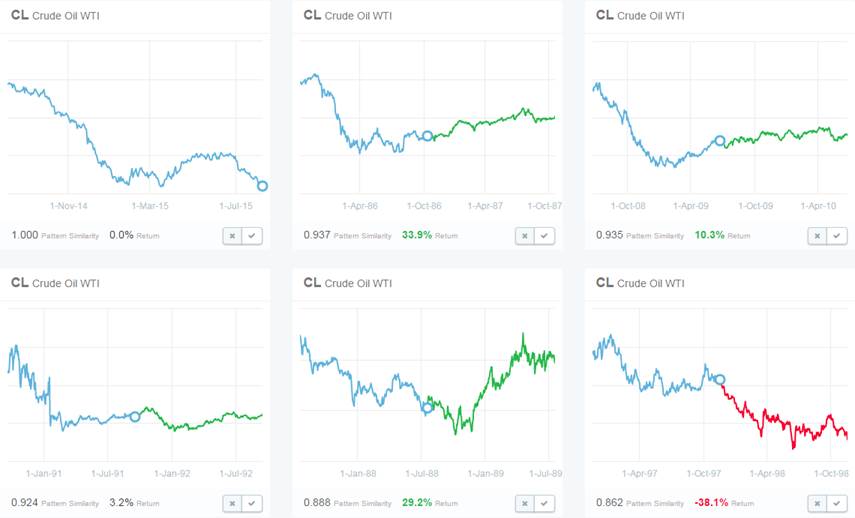
Here is a view of the patterns of each of the 5 most similar historical matches in comparison to the current 1 year price trend in Crude, with the next 1 year in each highlighted in green or red.
The Statistics
The table below shows the 1 year forward returns after each of the 12 historical matches. There’s only one instance from 1997-1998 that is down more than 10%. The average return is 28%.
Have a great week!