
Fundamental Valuations Meet Statistical Probabilities (GMCR, CVRR, HSP, UNP, RYN, FSLR, ATO)
May 26, 2015"He is one of the most undervalued players in baseball. This guy should cost $3 Million a year. We can get him for $237,000."
-Pete Brand, Moneyball, 2011
“Billy, this is Chad Bradford. He is one of the most undervalued players in baseball. His defect is that he throws funny. Nobody in the big leagues cares about him, because he throws funny. This guy could be not just the best pitcher in our bullpen, but one of the most effective relief pitchers in all of baseball. This guy should cost $3 Million a year. We can get him for $237,000.” – Pete Brand, Moneyball, 2011
It’s Spring time, so let’s say you’ve made the rash decision to buy a home out in the suburbs. The most important factors you and the Mrs./Mr. have decided upon are size of the house and yard, quality of schools, proximity to public transportation and style. You find two homes in different towns that are on very equal footing given the key “fundamental” drivers behind this decision.
In one town, based on an analysis of recent home prices, your agent tells you that prices are likely to continue falling before settling. In the other town, the agent shows data revealing that house prices are starting to really take off. You’re not sure if you will end up staying in the house for a long time or if a job move will necessitate an earlier sale than intended. What’s the more appealing buy?
EidoSearch does predictive analytics across both public and proprietary data sets, and we have done a deep dive on price trends to provide probabilities to the investment community. We can look at the trajectory of a stock’s price, and by finding similar price trajectories in a peer group historically, we have validated that there are conditions that contain valuable information about future returns that complement fundamental valuation statistics.
Let’s assume stocks are typically up around 55% of the time in the next month. There are times, based on certain patterns, that the projected return distributions are very different than the historical average of 55%. EidoSearch harnesses this information. If the fundamentals play out the way we are forecasting, what is the likely price range in the next 1 month, 3 months, 1 year? What if we’re wrong, what’s the likely downside?
If your spouse loves the house in the town where prices are still falling, wouldn’t it be nice to have a gauge on how much further they are likely to drop? How much longer?
For today’s market call, we decided to look across sectors to find some outliers. Stocks with 1 month forward return probabilities that are much more positive than the average. All mid-cap or bigger and one top selection per sector.
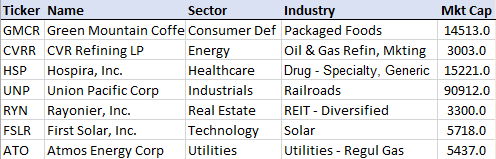
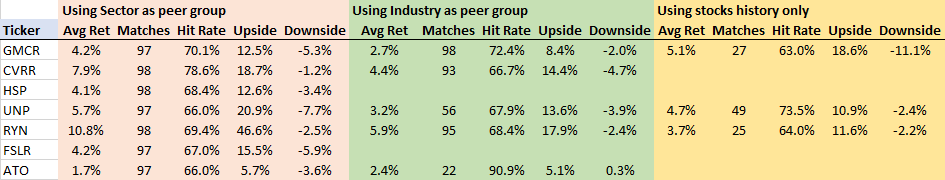
We looked at the 3 month patterns for each of these stocks, and compared them to a peer group to inform us of the probable range of returns in the next 1 month. We did this in three ways, using the sector as the peer group, then narrowing to the Industry for matches and then finally only looking at each stocks own history. If there’s a blank, there were not enough matches to have statistical significance so we removed them from the table below.
A few highlights:
· The risk premiums (upside to downside) for many of these stocks are tremendous
· The minimum historical hit rate for the patterns is 66% for sector or industry (well above the average of all stocks for one month)
If you like the fundamentals on any of these stocks, the statistical probabilities are in your favor. Good luck house hunting.
Have a great week!