
Goldman Going Higher?
October 19, 2015"China saves too much, produces too much, sells too much to Americans and consumes too little. "
-Henry Paulson
Last week we talked about the price trends for many Biotech’s flashing “rebound”, and we specifically highlighted the pattern for Biogen (BIIB). As of this writing, Biogen is up almost 8% in the past week.
After an uneven reporting of earnings last week for the largest U.S. Banks, we thought it would be interesting to see if any patterns were emerging that contained valuable information and carried the same kind of compelling probabilities as last week and that might be worth analyzing. The most interesting by far is Goldman Sachs (GS).
Goldman’s stock price performed well in the 1st half (up 13% through June 23rd), hitting a 7 year high and outpacing the market (S&P 500) by about 10%. Three months later at the end of last month, including the August sell off, GS was sitting around $171 a share. A drop of almost -22% from the June high.
Goldman’s earnings announcement last week was a let down. They missed earnings and revenue expectations, with FICC revenues off 33% due to low volumes. Given the Banks continued focus and reliance on trading for revenues, and the fact that some of their peers had good quarters, you would have expected a negative reaction by stock holders. However, the stock is actually up over the past few days since their earnings release. Is this a good time to buy into a position or build it up?
We looked at the current 3 month pattern for GS, and analyzed it in two ways: We searched for similar patterns historically in Financial Services Stocks, and then ran a separate study looking for similar instances of the pattern just in Goldman’s trading history.
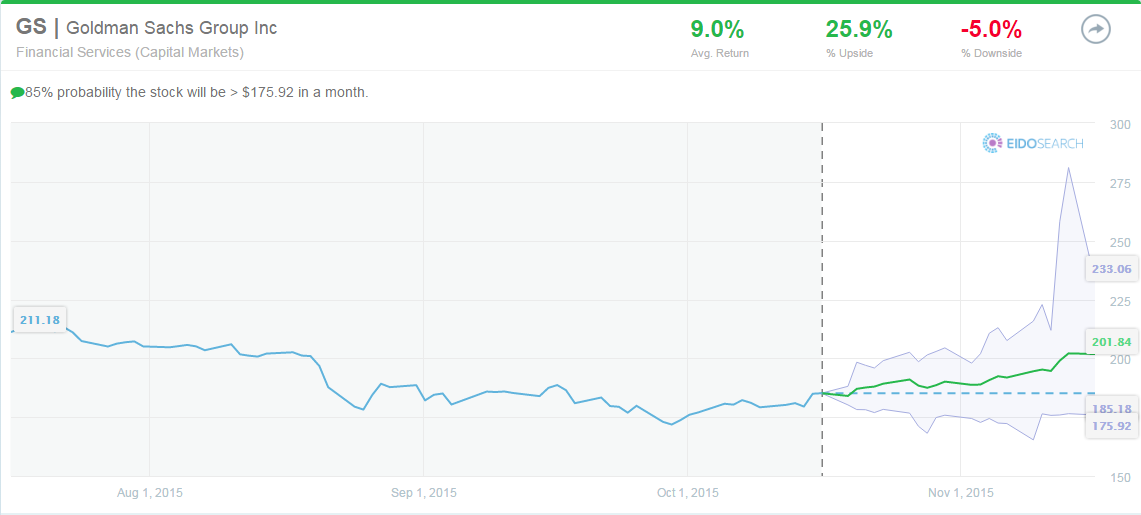
Average Return of the Pattern in Financial Services stocks is 9.0% in the next month
We found the 35 most similar matches historically within financial services, and then looked at the outcome in the next 1 month historically. The average return is 9.0% with more than 5x the upside to downside, and the stock is up 68.6% of the time.
Next, we wanted to find times where Goldman itself traded in a similar fashion historically. We loosened the similarity measure a bit to find a statistically significant number of matches, and the results were also very positive.
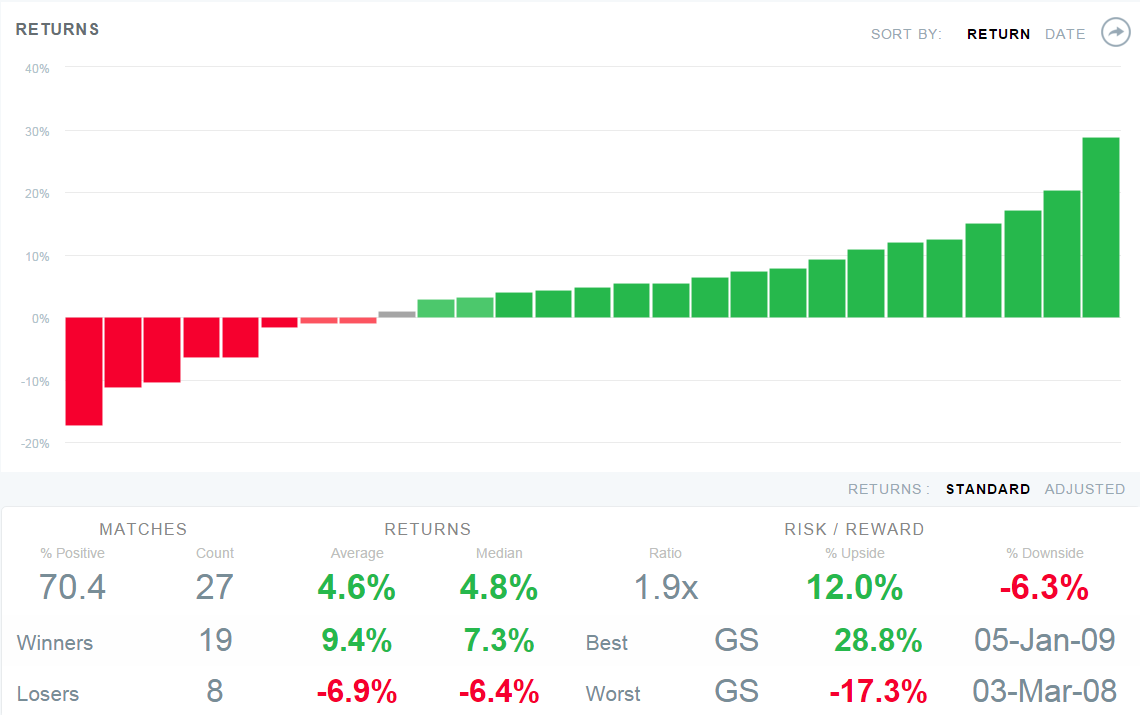
GS is up 70.4% of the time in the next one month
We found 27 similar matches, and the average return in the next one month is 4.6% and per the chart below you can see the stock is up 70.4% of the time. The only instance down more than 10% is in 2008, and there are 7 instances that rebound more than 10% in the next one month.
Looking at relative returns to the S&P 500 of the historical matches, the results are just as impressive with an average return of 4.2% in the next month and with the stock being up two thirds of the time.
Have a great week!