
If Netflix (NFLX) Beats Expectations the Stock will….
By EidoSearch"You must always be able to predict what’s next and then have the flexibility to evolve."
-Marc Benioff, Founder of Salesforce.com
Netflix is up 42% over the past three months. Although the stock gave back a bunch of gains in March, it has popped another 9% over the past week after announcing that their members watched over 10 billion hours in the past quarter. The EidoSearch team has accounted for a few of those ourselves.
We’re now two days out from their Q1 earnings announcement, and investors have done their fundamental work. Models and price forecasts have been adjusted, consensus is being built for expectations and asset managers and hedge funds are, in many cases, adjusting their positions going into the print. Some managers are looking to take advantage of better than expected results, and others are getting smaller or mitigating risk based on their fundamental view of the company’s performance vs. expectations.
This is now where EidoSearch comes into play to impact profitability. When has a peer stock (we’ll use Sector here) traded over the quarter and into the earnings event (specifically two days out) in a similar fashion in recent history, and what are the range of outcomes? How can you use this data point?
We’ve made it easy for investors to quantify the range of likely outcomes. We found 72 similar instances in the peer group over 10 years. Some of these companies blew out the number, and some had disastrous results or forward guidance compared to expectations, while most fell somewhere in between.
What EidoSearch provides is the statistics for this range. If you feel the company will beat expectations, how much is the stock likely to run up in the next month? If the stock misses, how badly will it likely get beaten up. We provide the range of outcomes so investors can get a much better gauge for position sizing and the inherent risk premium. Consider us scenario analysis for earnings to complement your fundamental opinion and drivers.
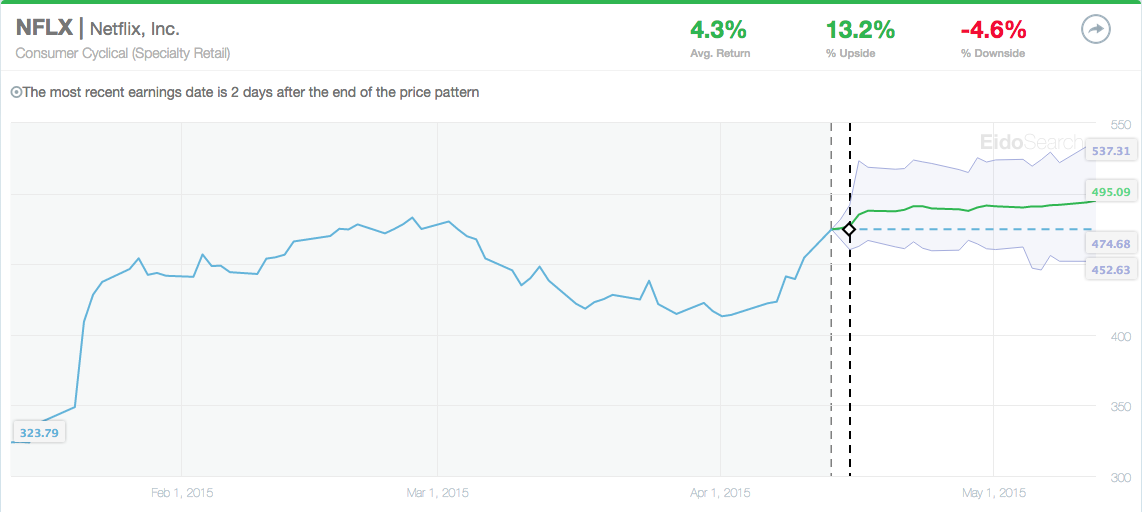
For Netflix, the statistics show that the typical outcome is up, but that there’s more than 2x the upside to the downside when looking at the past results of the 72 peer companies that traded into the print in a similar fashion. We’re not predicting results here! Again, we’re giving an objective gauge on how the market and stock will react under similar conditions no matter what scenario takes place. Here are the visuals:
The average return of peers historically is 4.3%

More importantly, here are the range of returns under similar conditions in the peer group historically. The stock is up 63.9% of the time, and for the tails, you can see there is only one instance down more than -20% in the next month and 6 that are up more than 20%.

Netflix is one of those matches that is up more than 20% historically. Per the charts below, you can see the similar trajectory for the stock price this past quarter vs. their earnings release in Q1 of 2013. Two days out from the release in both instances. The stock was up 40% in the next month two years ago.

If you use Options to hedge around events like earnings, you can see that we can also overlay implied volatility on our forecasted return distributions to show investors where options might be cheap or expensive based on upside, downside or overall magnitude differences. In this example, we are projecting less downside risk than the symmetrical cone of implied vol (based on normal distributions) suggests.

Have a great week!