
Is the Herd Right about Japan?
June 22, 2015"I belong to the warrior in whom the old days have joined the new"
-Katsumoto, The Last Samurai
There seems to be growing consensus in the investment community that the Japanese stock market is one of the better places right now to invest.
The Fed has once again pushed back expectations for a rate hike until later this year, and the markets have once again rallied. Last week the Nasdaq eclipsed its 15 year high from the dot com days (scary) and investors are ever concerned about valuations. Most developed European markets have been terrific this year, but have begun stalling with the ongoing Greek debt issues and have been increasingly volatile.
Japan on the other hand is side-stepping some of the global macro issues, and although the Nikkei is up 40% over the past 8 months, still looks to have upside. Based on data from April, appearing in the WSJ on May 1st, Robert Shiller’s Cyclically Adjusted Price to Earnings ratio (CAPE) for Japan is currently 23.7 vs. its historical average of 34.4.
We cranked up our predictive analytics engine to evaluate patterns in the data in three different manners based on varying indicators. Depending on how you look at the markets, one of the scenarios we’ve investigated might resonate more than the others.
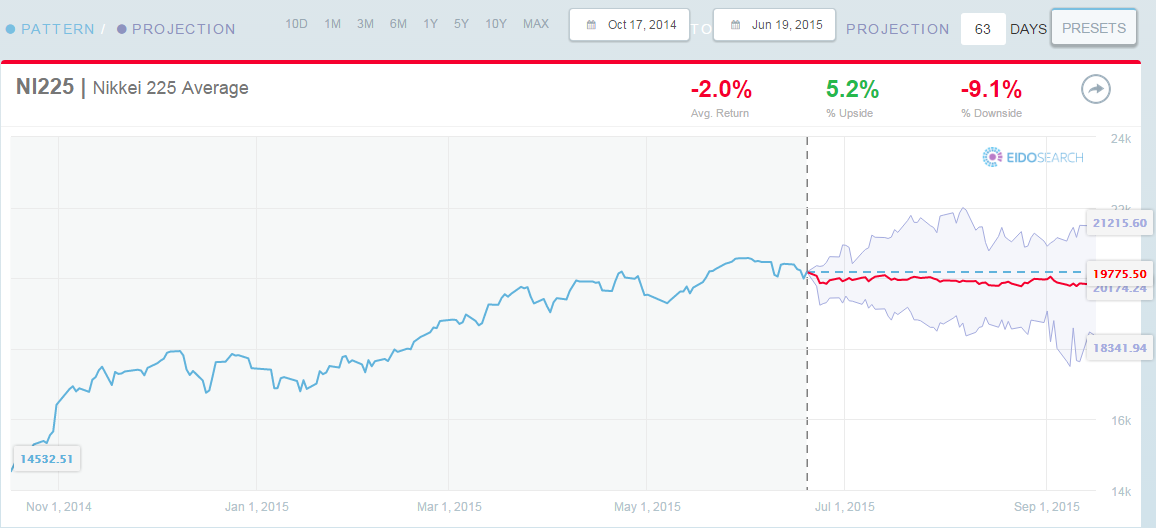
Scenario #1:Looking for similar historical instances of the Nikkei’s 8 month trading pattern, to see how it typically performs in the next 3 months.
Here, we took the current 8 month price trend and looked at 20 years of history in the Nikkei to find the most similar instances. The Nikkei is down an average of -2.0% in the next 3 months.
Per the table below, we found 22 statistically similar matches and the Nikkei is down 63.6% of the time in the next 3 months an average of -2.0%.

Scenario #2: Looking for similar historical environments via 8 month patterns in both the Nikkei and the S&P 500
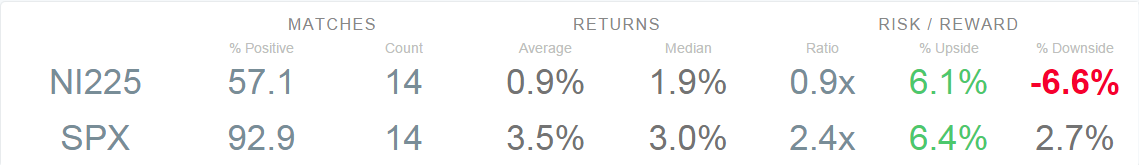
We did a multi-variable analysis looking at price trends in both the Nikkei and the SPX to find times historically where both had similar trading behavior at the same time over 8 months, and then what happened in the next 3 months.
While the S&P 500 has performed well in these 14 similar environments, the Nikkei is only up 57.1% of the time in the next 3 months an average of 0.9%.
Here’s the chart of the current patterns in the Nikkei and S&P 500 we searched for historically:

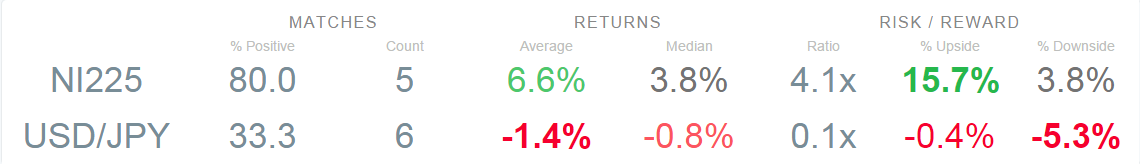
Scenario #3: Looking for similar historical environments via 8 month patterns in both the Nikkei and the Dollar Yen
With the Yen’s weakening trend vs. the Greenback, we did a multi-variable analysis looking at the Nikkei and the currency pair. We only found 5 similar instances over the past 20 years, but you can see that the Nikkei is up 80% of the time an average of 6.6%.

Feel free to contact us at info@eidosearch.com if you would like us to look at a custom variation of the above analysis for you.
Have a great week!