
Natural Gas in 6 Months Factoring Seasonality
By EidoSearch"The cheapest Natural Gas in the World is in the United States"
-T. Boone Pickens
Natural Gas prices are at 3 year lows and about half of what they were at this time last year. As they say in the party game LIMBO, “how low can you go”?
May and June Futures rebounded a bit last week, in part based on expectations that warmer weather forecasts for early May in many parts of the country might help move us out of the low demand lull of Spring. However, Natural Gas storage supplies are still well above the levels at this time last year and production is starting to pick up again (recent announcement from Baker Hughes as an example).
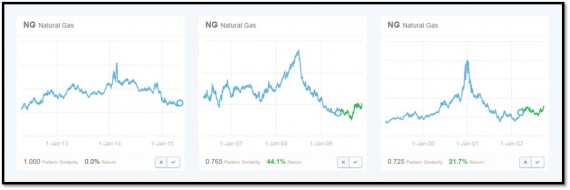
To get a gauge on what the longer term price move might look like, based on similar environments historically, EidoSearch ran a quick study to find similar instances of this current 6 month price trend in Natural Gas over 25 years of history. We also narrowed in the search, to look only for instances of the current price that end in Spring/Summer (seasonality) and used two different measures of mathematically similarity. One measure is based more on the shape of the pattern, and another based more on the size of the price moves over the 6 month period.
6 month projection using “shape” as primary similarity measure
We found 13 similar instances of the current 6 month price trend in Natural Gas since 1990, where the price trend ended between April 1st and July 15th. The average return in the next 6 months is 21.8%
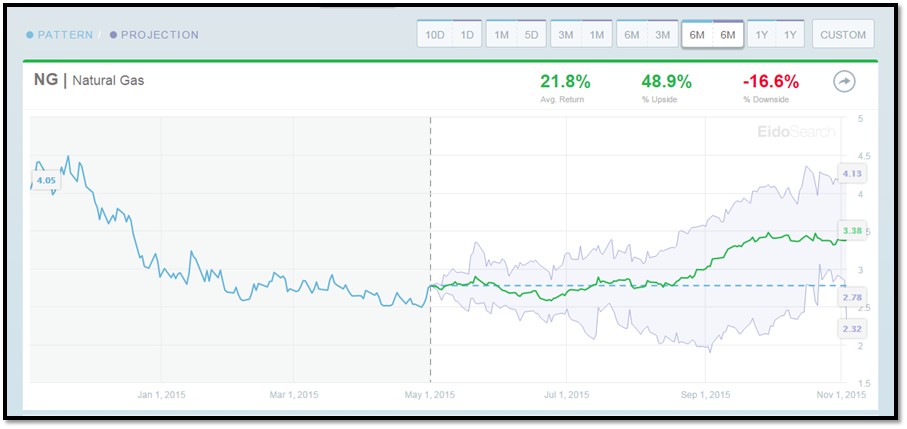
Natural Gas is up in 10 of the 13 matches in the forward 6 months.
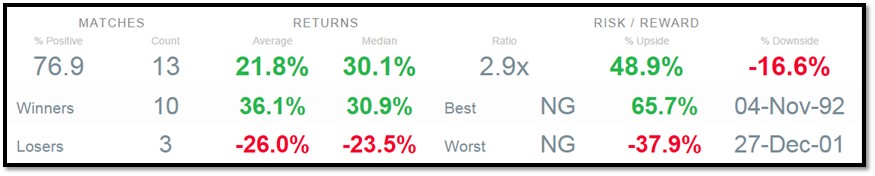 The 13 analogs are listed in the table below. The 3 instances where the down trend continues are: 1998, 2001 and 2010.

6 month projection using magnitude/size of the price moves as the primary similarity factor
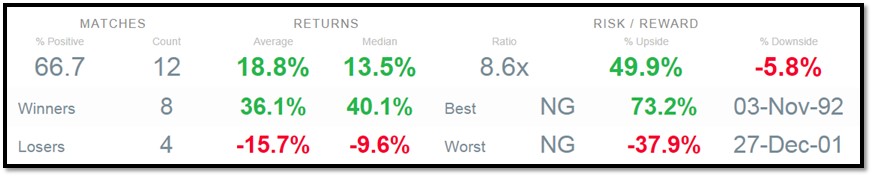
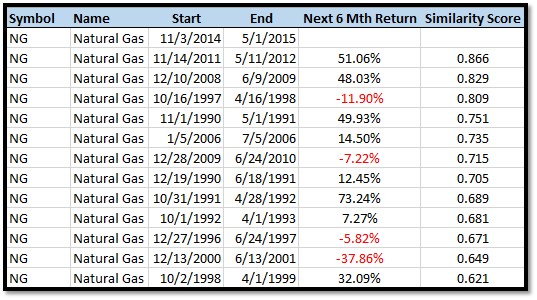
We found 12 similar instances of the current 6 month price trend in Natural Gas since 1990, where the price trend ended between April 1st and July 15th. The average return in the next 6 months is 18.8%
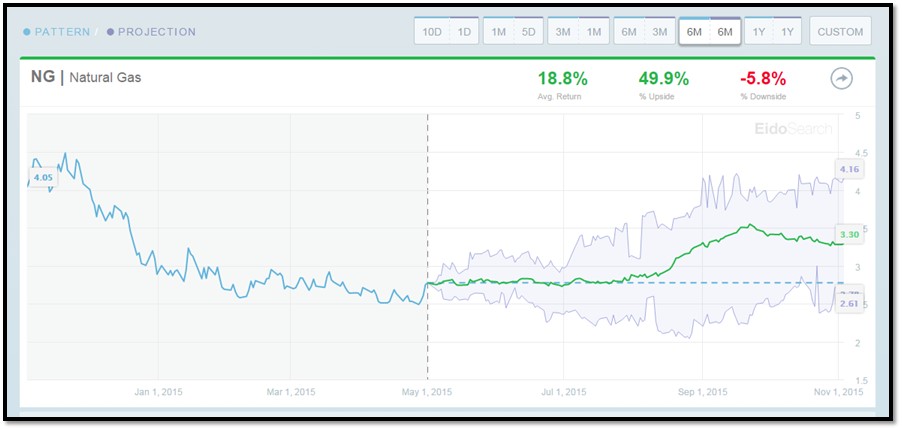
Natural Gas is up in 8 of the 12 instances in the next 6 months.
 The below analogs show that 1997 is a similar match using “magnitude” of the price action, that we didn’t capture previously using the “shape” of the pattern, factoring seasonality.
Per the above analysis, regardless of characteristic of mathematical similarity, Nat Gas is up in similar environments the majority of the time with much greater upside than downside.
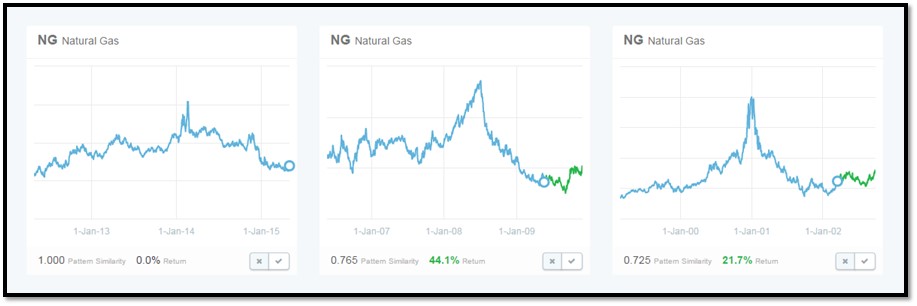
Finally, instead of using a 6 month price trend, we looked at the full 3 year price trend to capture the full pattern from when we were last at these price levels. Using Shape as the primary similarity factor, we found two similar matches from history: 2002 and 2009, where prices rebound an average of almost 33% in the next 6 months.
 Have a great week!