
Predictive Analytics and the Week’s Best Trade Ideas
November 16, 2015"Well, Dick, here’s the deal. I’m the best there is. Plain and simple. And nobody can handle my stuff. I’m just a big hairy American winnin’ machine. If you ain’t first, you’re last. You know, you know what I’m talkin’ about?"
-Ricky Bobby, Talladega Nights, 2006
The impact that emerging predictive analytics technologies are having in the investment community continue to broaden, and they include critical business function like fraud detection, client acquisition and retention, security research and quantitative or robo investing.
One of the greatest benefits we see at EidoSearch, and with our new methodology for prediction, is the ability to quantify the value of information contained in data sets and especially Big Data. For example, is it even worth spending months of time analyzing traffic patterns in parking lots at shopping malls? The other great benefit is that once you’ve identified that valuable information exists in a data set, you need the ability to interrogate the data with speed and accuracy to generate meaningful analytics and ongoing signals to help drive business decisions.
A good example of this is with the analysis of patterns in securities prices. What took quantitative investors years to process into meaningful signals a decade ago, we are now able to do in weeks. EidoSearch can analyze up to 100 million patterns in a few seconds, and we have verified what many investors have already confirmed or suspected. There’s predictive information in price patterns. We’ve tested this with millions of simulations, and through running sample portfolios that continue to have a statistical edge.
For this week’s Market Call, we wanted to apply a simple exercise and show how we can easily help investors find valuable information from a huge set of data. To do this, we decided to look at the price patterns of over 5,000 U.S. stocks, and identify those with the most compelling positive and negative analytics for the next one week to generate some trade ideas.
Here is the criteria we used:
· One week forward projection using month long trading patterns
· Required minimum upside vs. downside (and vice versa for shorts) ratio of 2x
· Required good average return as well as a consistent reaction to the pattern (hit rate) historically
· Looked for pattern matches in the sector, but also required that the statistics be similarly impressive if looking at narrower industry level
· Minimum market cap of $500 Million
· Minimum number of matches of 30 (to get statistical significance)
Drum roll please……here are a few of outliers:
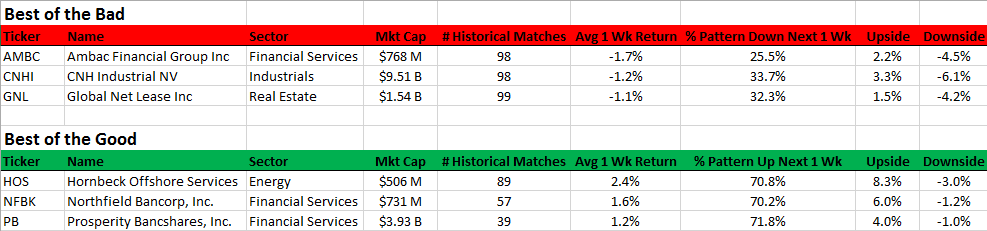
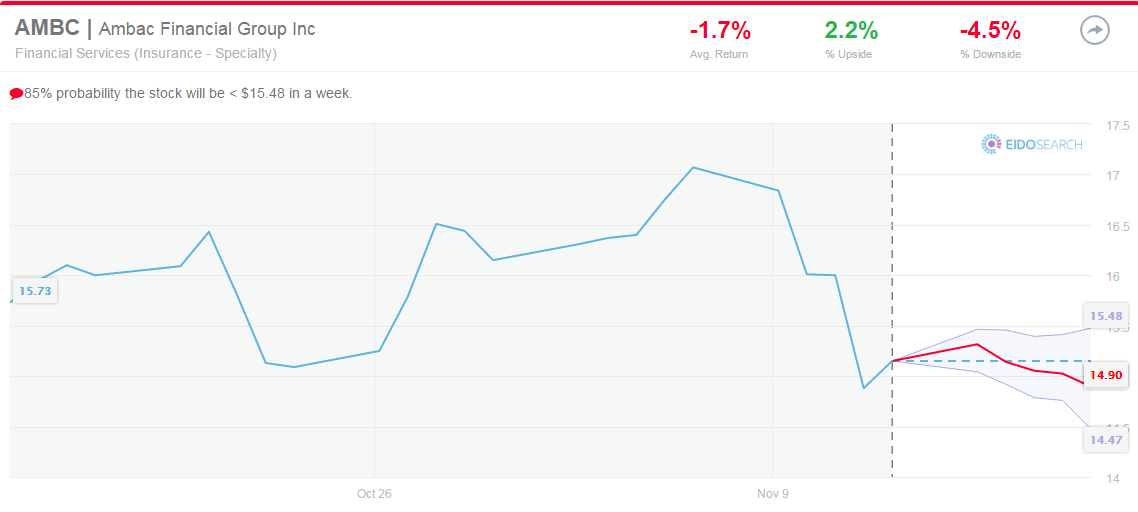
We thought we would highlight one, Ambac (AMBC), with expanded data and graphics to put some additional context behind the statistics. Here’s the projection chart for 1 week out. You can see that the stock is off a lot over the past couple weeks, but it had a reprieve and rebounded last Friday. Does the rebound typically continue for peer stocks when they’ve traded like this?
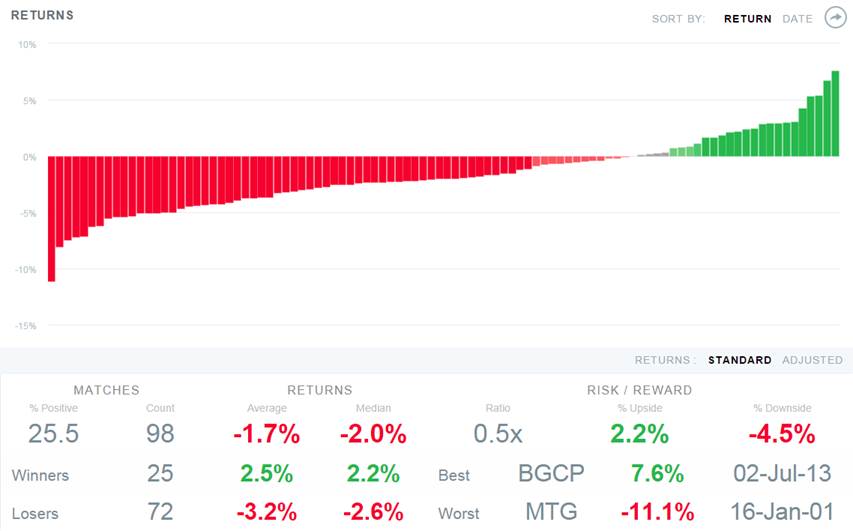
Nope. Per the stats and return distributions table (next 1 week return for each of the 98 historical matches) below, you can see that in all different environments over the past 40 years, Financial Services stocks that trade like this are down almost 75% of the time in the next week. The average return is -1.7%, and the average relative return to the S&P 500 is -1.4%.
If one of these stocks announces a merger or insider trading scandal, then the trading behavior, pattern analysis and statistics are meaningless as we all know. However, there’s a statistical edge this type of information can provide with how stocks typically perform in the next one week, and these are a few interesting examples worth checking out.
Have a great week!