
The S&P at an All-Time High….and Going Higher?
By EidoSearch"Phil Connors (Bill Murray): Do you ever have déjà vu, Mrs. Lancaster?
-Groundhog Day, 1993
Mrs. Lancaster: I don’t think so, but I could check with the kitchen."
Here we go again. The S&P 500 ended 2013 at an all-time high, sitting at 1,848 on December 31st of that year. It was still around that level last January 22nd, at 1,844, when the markets got spooked and the S&P dropped 6% over the next couple weeks. But, by mid-February, the market was back to hitting new highs and ended the first quarter of 2014 up a respectable 2%
This past December 29th, the S&P 500 was at an all-time high again of 2,090. The markets have once again been volatile, and the S&P pulled back to the tune of a 5% drop to 1,992 by January 15th. But, here we are a few weeks later, and the S&P is once again is sitting at all-time highs. Do we repeat last year’s recovery from a poor start and finish the first quarter on a positive note?
There are ongoing concerns with Greek debt and the potential trickle down effect, and although it’s not on the front page, U.S. market valuations are becoming a growing concern for many especially with the specter of rising interest rates on the horizon. With that being said, the positives clearly continue to outweigh the negatives.
Crude Oil prices seem to have found some footing and lower prices at the pump are fueling consumers. The economy continues to strengthen here at home, the run of the U.S. dollar is starting to slow and 4th quarter earnings data looks very good. In fact, 391 of the S&P 500 companies have reported earnings so far, and 71% have beaten expectations according to Thomson Reuters.
Last year is certainly a good gauge for how the market is likely to react in the next few months, but is there additional precedence?
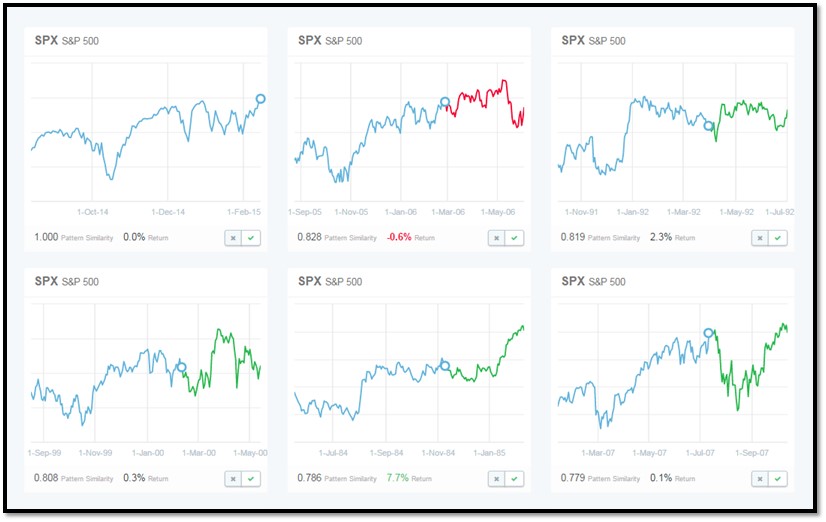
EidoSearch decided to look back a little further to include the past 6 months trend in the S&P 500 (so we could include the higher volatility and drop and recovery from Q4) to try and identify similar instances historically. We found 9 similar instances dating back to 1984, and the S&P is up in 7 of the 9 instances and the average return in the next 3 months is 1.7%.
Although the average return is not overwhelming, the two down instances from 2005 and 2006 only give back -1.4% and -1.5% respectively. Here’s a table of all 9 instances:

6 most similar historical comps to the current price trend

3 month forward return distributions of the 9 most similar historical instances of the current 6 month price trend in the S&P 500.

Have a great week!