
The Last 6 times Janus traded like this?
December 7, 2015"Whenever I read the newspaper, I say to myself, ‘At least my wife loves me.'"
-Bill Gross, Janus
When Bill Gross announced he was leaving PIMCO to join Janus Capital Group on September 26, 2014, the stock jumped about 43% in one day closing at $15.89.
We had seen similar extreme moves in Financial Services stocks historically, and EidoSearch was able to analyze the trading pattern (reactions to similar moves historically) to accurately predict how the market was likely to react over the next month. See our Market Call from September 29, 204: The Knowledge – What’s Next For Janus
It’s easy to look back now and say that the stock was ripe to give back some of those gains, but at the time there were plenty of people confident that the stock would continue to run up on the news. And those that thought that the stock would fall, didn’t have a barometer for how far. This sort of sums up what we do, and the power of predictive analytics applied to the financial markets. The ability to look at patterns in data and to objectively identify where there is a statistical edge and where the probabilities are in the investors favor.
It’s sort of like the current GEICO commercials, “if you want to save 15% on car insurance, it’s what you do.” (Peter Pan at his High School Reunion). Well, this is what we do.
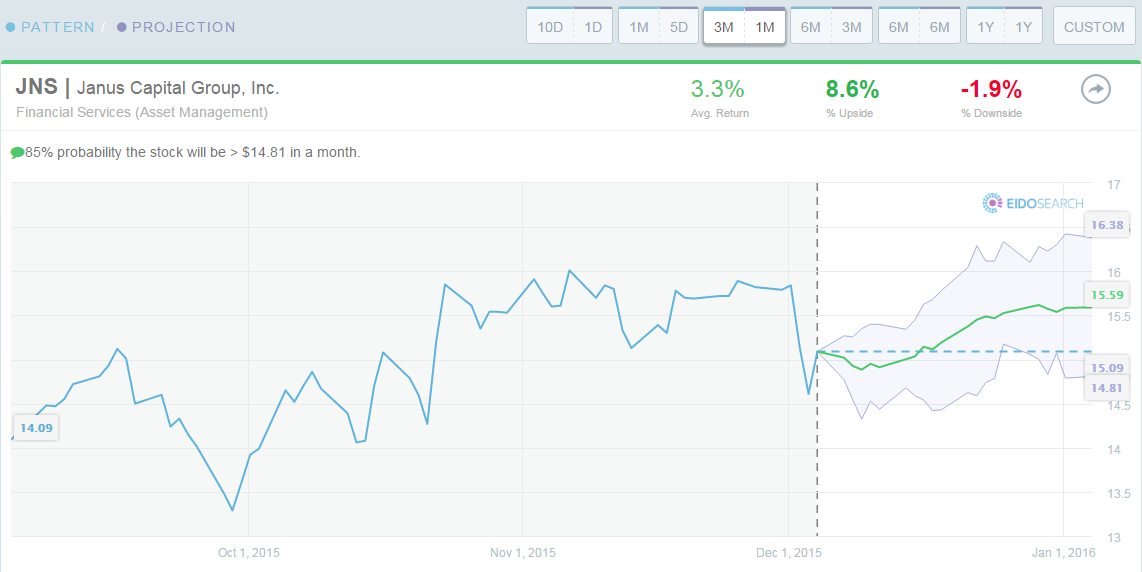
So, over a year later, we’re taking another look at Janus (JNS) which has a pattern we’ve seen many times before, and that once again has statistical probabilities that are compelling. The stock rose as high as $18.75 over the summer, but has faltered and sits at $15.09 as of Friday’s close and below the price when the announcement of Bill Gross joining hit.
We looked at the current 3 month trading behavior in Janus, and evaluated it in the EidoSearch engine in a robust way to assess the 1 month forward probabilities. We looked at the pattern against the full sector (Financial Services) to find similar instances in the past, and then also just at the industry (Asset Managers) and then just Janus’ own history.
As you narrow in on the peer group, the statistics become even stronger. Per the table below, the upside to downside ratio is a minimum of 3x whether using sector, industry or Janus’s stock as the peer group, and the hit rate of the pattern historically is about 70% comparing against the industry and Janus’ stock history.
![]() Here’s the projection for Janus, using their own trading history, for the next 1 month:
Here’s the projection for Janus, using their own trading history, for the next 1 month:
Also interesting? The last 6 times Janus has traded like this in a mathematically similar fashion, the stock has been up an average of about 5% in the next month. Looking at the most similar matches in Janus’ history, 5 out of the 6 were up in the next one month.
Have a great week!