
The VIX in One Month?
By EidoSearch"Markets Love Volatility"
-Christine Lagarde
The VIX was up 16% last week, as the S&P 500 dropped for 4 straight days before recovering with a modest gain on Friday with a little help from Janet Yellen. It was the worst week for the U.S. market since January.
Once again though, the Fed is coming to the rescue of stocks. Her prepared remarks late on Friday reiterated that a rate hike “may be warranted”, but also provided some insight on long term rates saying that a return to a normal Fed Funds rate was “likely to be gradual”. Global Markets are up big this morning, as are U.S. Futures. So, for the time being, concerns over Yemen and Oil disruption, confirmation of a crappy GDP number and increasing profit warnings from companies have been swept under the rug.
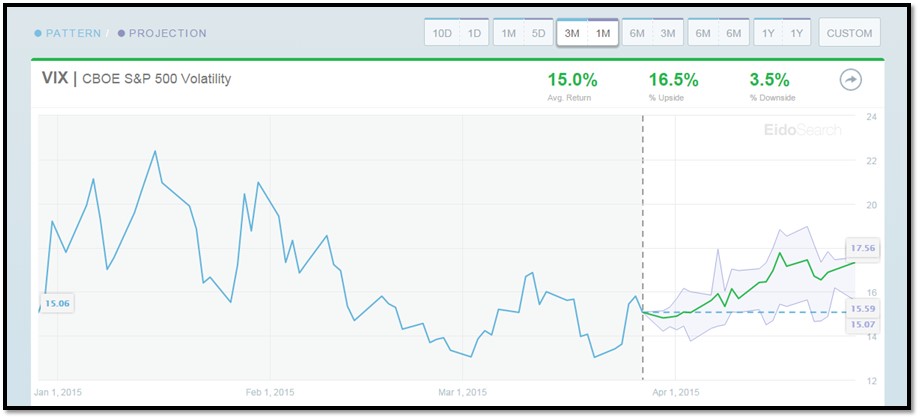
Although the VIX was up significantly last week, it’s down from a high of more than 22 in mid-January and looks set for another nice decline today. Should we expect the downtrend to continue?
EidoSearch took the current 3 month price trend in the VIX, and analyzed it’s history (with one click!) to look for similar instances historically and to capture the actual returns in similar environments 1 month forward. We found 11 statistically similar matches.
The following chart provides a projection in the next 1 month for the VIX and an average increase of 15.0%

This table shows the historical return distributions for the 11 instances, and the significant positive skew

Have a great week!