
We Were Right! Right?
January 25 2016"The Most Ominous Snow Forecasts For New York City Were Right"
-Harry Enten, senior analyst for FiveThirtyEight

Central Park’s weather station recorded 26.8 inches of snow, surpassing the blizzard of 1888, and just 1/10th off from breaking the record set in Feb 2006. So if you’re under the age of 10, this was a storm of a lifetime.
With most of the city shut down, we had a little extra time this weekend to think about forecasting accuracy. As FiveThirtyEight commented, “New York City is getting far more snow than the forecast of 7 to 12 inches from the National Weather Service….It’s the perfect example of why forecasts that vary based on probability are so important, and why outlier predictions should not be dismissed.”
We’ve made four forecasts on the S&P this year, including the one at the end of this email. What’s our track record?
Setting aside a rigorous statistical framework (for now), let’s explore one method of evaluation. In the parlance of tennis, here’s our scoreboard for the 4 market calls (eidosearch vs. eidoskeptic):
- Jan 04 “15-Love”
Explanations are Not Predictions
We predicted the S&P would be down. It was.
- Jan 11 “15-All”
What Chuck Norris Thinks About the S&P
We predicted the S&P would be up. Oops. It wasn’t.
- Jan 19 “30-15”
Long The Big Short
At the height of market fear, we predicted the S&P would be up. It was.
(We should get extra credit for this one)
- Jan 25 “[?] – [?]”
We Were Right! Right?
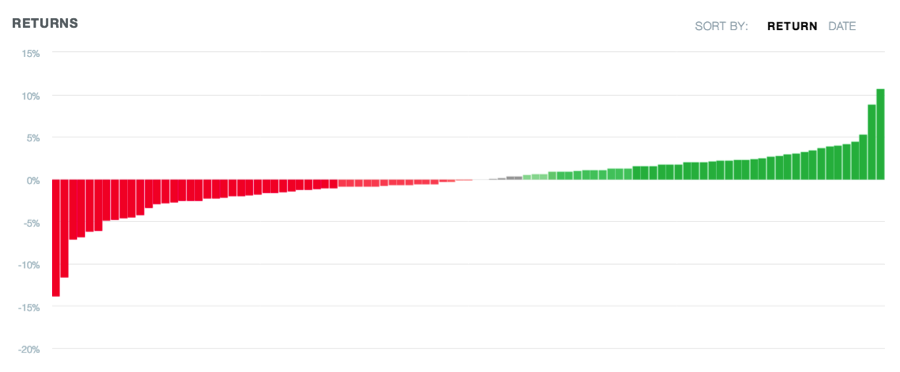
Our five day average return forecast is down -0.2%. The prediction is based on a distribution of returns (see the chart below).
Five days from now, at the close on Friday, how are we going to measure right from wrong? Note that the tail to the left is getting fatter and redder compared to last week. That’s important information. We care about the average, the spread, and the tails – the full spectrum of risk and reward.
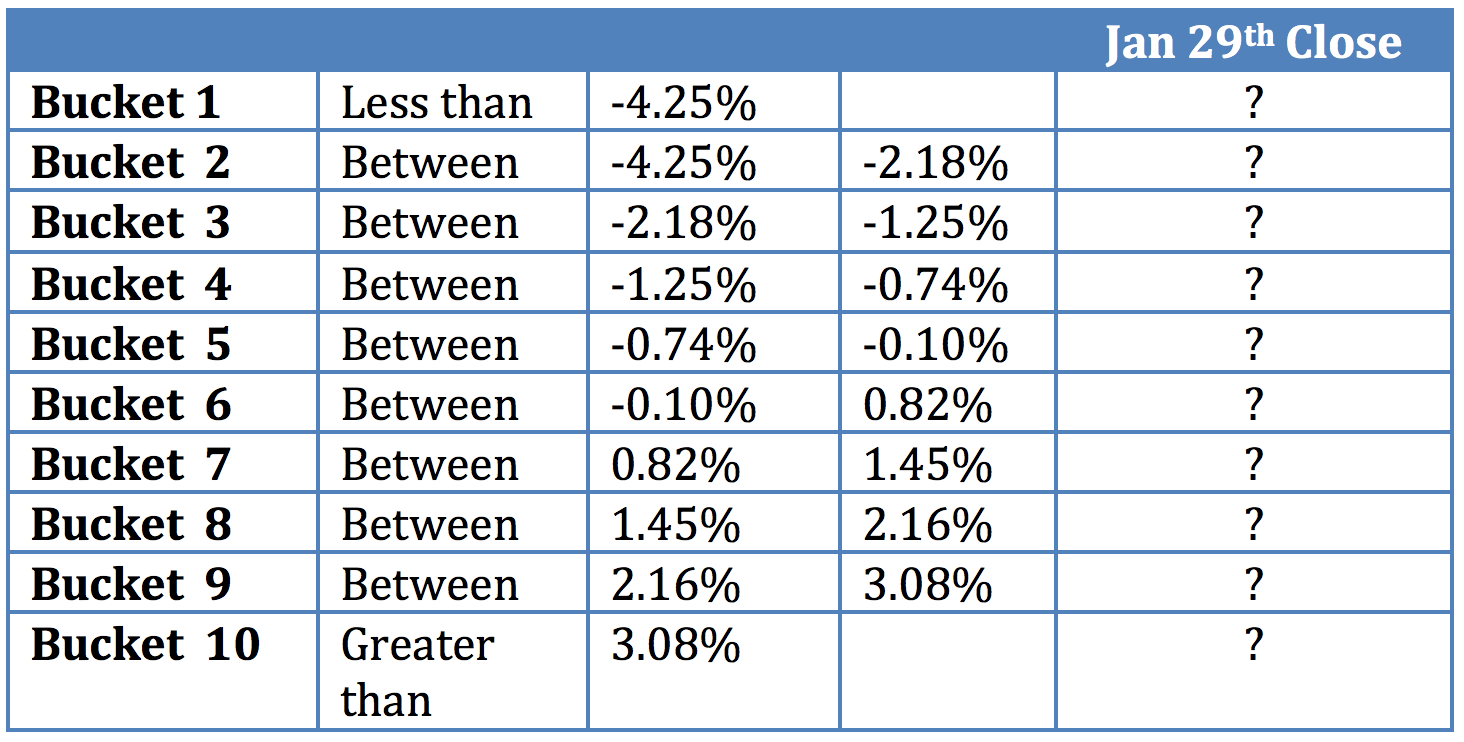
We need a better way to measure prediction accuracy – a more informative scoreboard. What we need are equal probability buckets.
To get into the mindset, take a few seconds to write down 9 returns from largest to smallest. Returns that you think are within the realm of possibility for the S&P to reach by Friday at close.
Here are our equal probability buckets. There is a 10% probability that the S&P in the next 5 days will fall within each of the following 10 buckets:
 Next week, we’ll cover in more detail the subject of judging the accuracy of forecasted distributions, and how to use these distributions to your advantage.