
Precedence and Projections for Crude in 3 Months
November 2, 2015"If I told you I knew a place that had oil, where land could be bought cheaply, what do you think that would be worth?"
-There Will Be Blood, 2007
If I told you that we’ve seen Crude Oil trade in a similar fashion historically, and that the probabilities greatly favored a rebound in the next three months vs. continued deterioration, what do you think that would be worth? (Subscription offer at the end).
The last time we analyzed patterns in Crude was at the end of August when prices jumped over $10 in just 3 trading sessions. We warned on August 31st that we had seen this trading behavior many times before, and that the probabilities heavily favored a drop in prices in the next week with 4 times the downside to upside (http://www.eidosearch.com/crudes-rebound-short-lived/). Crude ended up dropping over 6% that week.
Some might say that was easy to see coming and that the rebound, as it often happens, was overdone. However, therein lies the difference between subjective opinion and even valid experience and the objective nature of EidoSearch statistics.
Crude has been on a roller coaster ride the past 6 months, dropping all the way from $61 a barrel at the end of June to $38 in the 3rd week before the aforementioned and short lived recovery. Chinese and global economic data continues to be underwhelming, Russia and OPEC are cranking out Oil and Iran is soon to flood the market as well. The factors for Crude at current are certainly unique, but the behavior driving trading in the commodity is not. The question we’re being asked by clients is, “has the market reacted in a consistent way to this trading environment in Crude historically?”
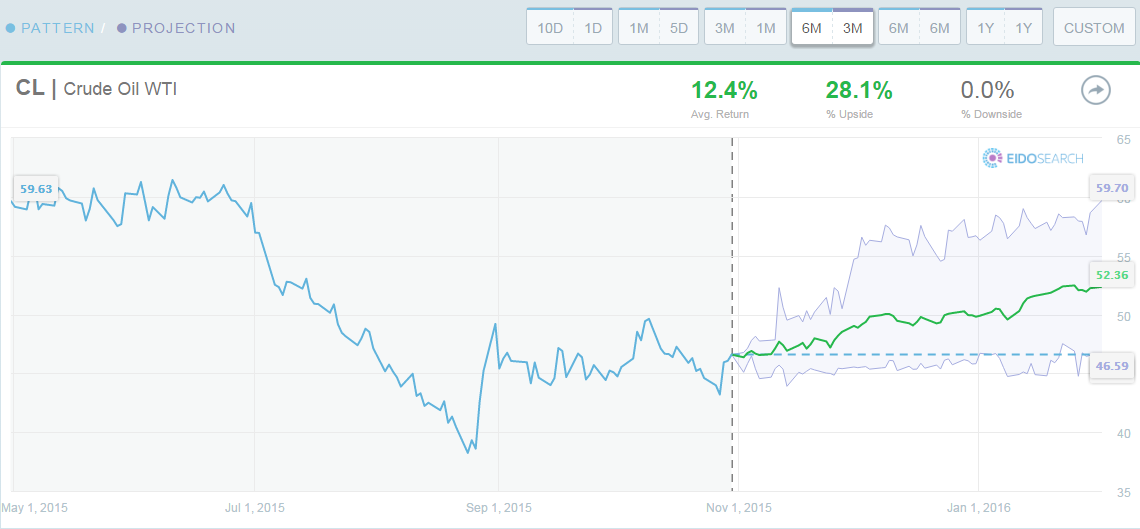
The Average return for Crude in the next 3 months is 12.4%
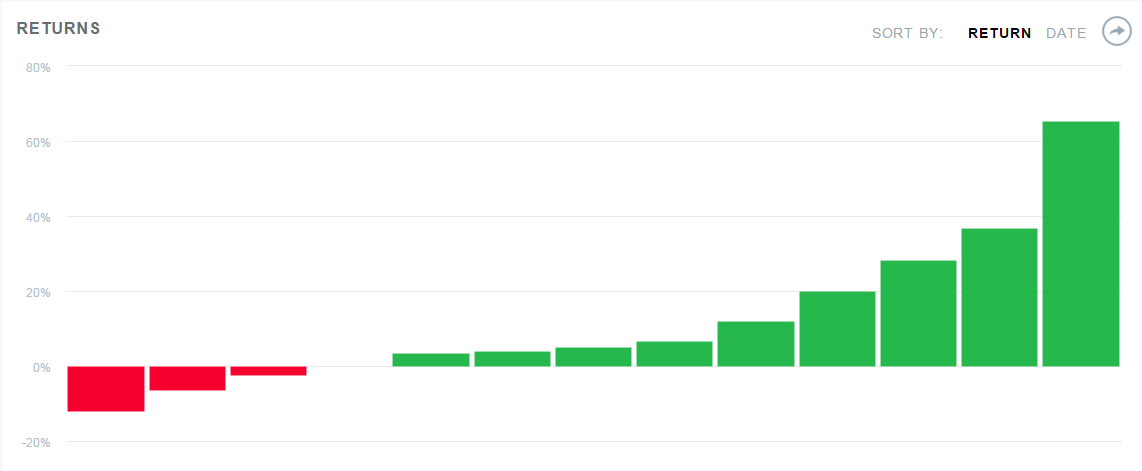
Per the chart below, we found 13 similar matches to the current six month pattern historically (with a high threshold for mathematical similarity). The average return in the next three months is 12.4%. Crude is up or flat in 10 out of the 13, and only one of the 13 is down double digits in the next three months (-11.9% in the fall of 1984).
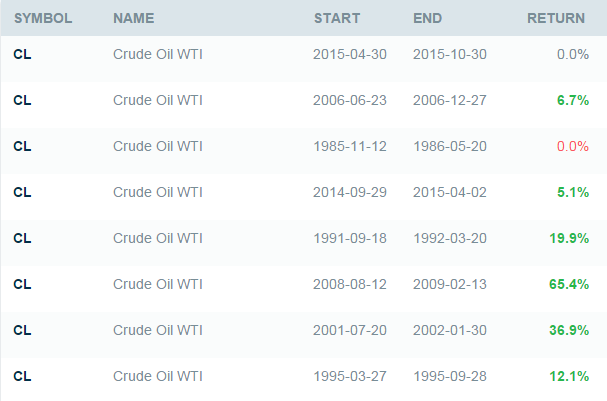
The 7 most similar historical matches are up in the next 3 months
One thing that’s particularly interesting when you look at the set of analogs is that the seven most similar matches are up (one flat) in the next three months an average of 20.87%. Here’s a table of the matches, and below it the return distribution for all 13 matches:
As mentioned at the beginning of the market call, we are running a promotional offer for first time subscribers in November. Please contact us at sales@eidsearch.com if you’re interested in getting objective insights and statistics on the markets and securities you follow.
Have a great week!